Who is winning F1, Kimi Antonelli or his Mercedes? I analysed every Grand Prix since 1950 to find out
BIG IF TRUE
BIT VERDICT #003
- The Claim: Kimi Antonelli is about to win the 2026 Formula 1 World Championship, more than 99.9% certain with six races to go: on the standings he is the best driver on track.
- The Catch: Points measure the driver and the car together, and this year the Mercedes is by far the best car.
- The Reality: According to the model, about three quarters of Antonelli's edge over the average driver comes from his Mercedes. But Antonelli clearly beats his teammate, who has the same Mercedes. With the car taken out, though, the strongest is still Verstappen.
With six races to go Antonelli has the 2026 title in his pocket: more than who will win, the interesting question is why. I used a predictive model, built on every Formula 1 race since 1950, to separate the driver from the car.
Scope: every championship Grand Prix (plus the Saturday sprint races) from 1950 to the Singapore Grand Prix of 11 October 2026 (round 17 of 23); final results only, no lap times.
BIG — Champion in all but name
When I was a child my most precious possession was a Ferrari cap with Mansell written on it in marker pen: the English driver who spent years coming close to the title, and then won it in 1992, after moving from Ferrari to Williams. That year the Williams, with its active suspension, was a rocket. After cheering, in the years that followed, the Italian anthem played after the German one with Schumacher, I came back to Formula 1 this year, drawn, I admit, by the chance to hear the same anthems in reverse order.
Few people bet on Kimi Antonelli at the start of the year: bookmakers gave him about one chance in ten, and the favourite was his teammate, George Russell. But Antonelli too, like Mansell, is riding a missile this year, and his is the child of new rules.
That is where my curiosity comes from: to study wins and placings with a statistical model similar to the Elo rating used in chess, one that also takes rule changes into account, to see whether the driver can be told apart from his car.
Let's start with the championship points. A win is worth 25, the places behind it fewer and fewer, and after Singapore Antonelli has 340, his teammate Russell 238. I simulated the rest of the season tens of thousands of times with the real points system, taking into account the retirement rate observed for each team. Antonelli is champion in more than 99.9% of them (Figure 1), and almost seven times in ten he is certain by Mexico City, on 1 November, at the latest. And he is not winning only because of the car: Russell has the same Mercedes and 102 fewer points. To win the United States Grand Prix on 25 October the model gives Antonelli 37%, Verstappen 20% and Russell 15%.
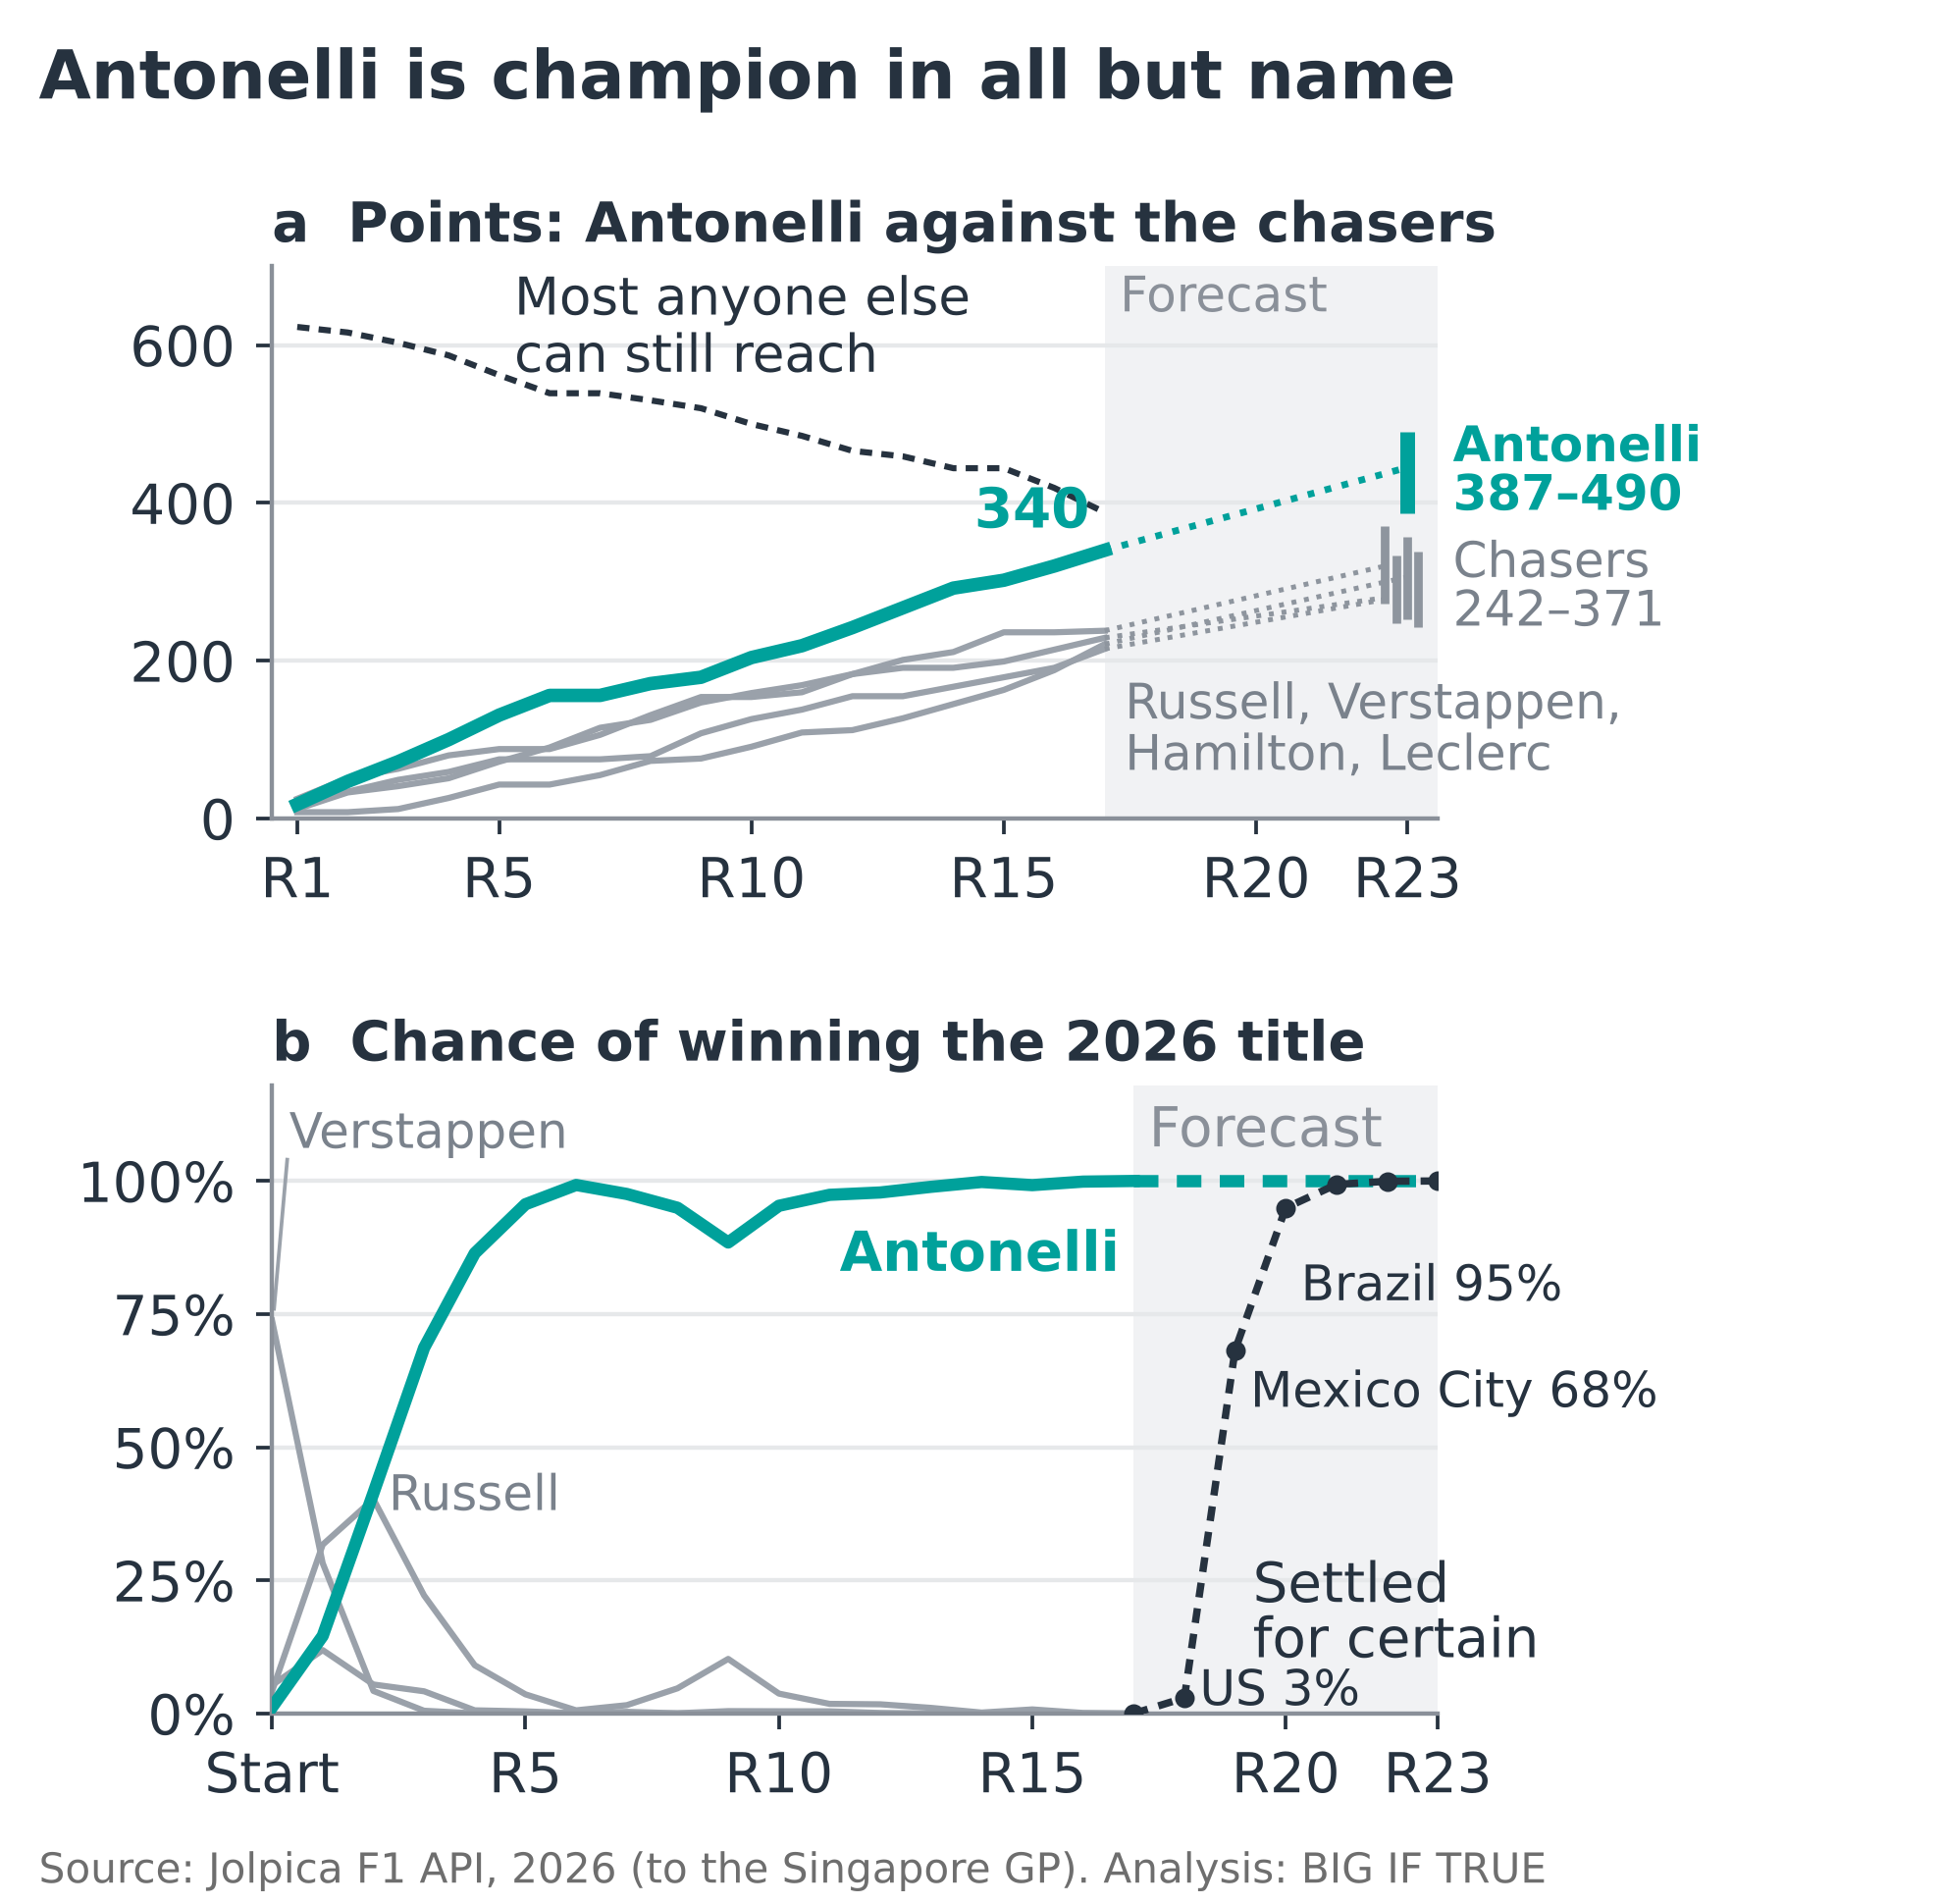
Figure 1. Antonelli is champion in all but name. (a) Points of Antonelli (teal) and of the chasers (grey) after each round. Dashed, up to Singapore: the most anyone else could still reach. After Singapore, the forecast: the median final points (dotted) and the range that holds 99% of the simulated seasons (bars). (b) Chance of winning the title before the season and after each round, according to the model (20,000 simulated seasons per round; 2,000 for the dotted line). Before the first race the model remembers 2025, and the favourite is Verstappen. Dotted: share of simulated seasons in which the title is mathematically settled after that round.
One thing the points do not see is who breaks down. This year the two Italian teams are among the most reliable. RB, Red Bull's second team (based in Faenza), has retired once in 33 starts. Ferrari 4 times in 34 (like Mercedes). The two Italian teams together retire 7% of the time, the other nine 22%. And people still complain about the reliability of Italian cars…
THE NUMBERS 340 to 238 — Antonelli's and Russell's points, with 150 still to play for 21 of 21 — leaders since 1991 whose lead was at least two thirds of the points still available, and who became champion (Antonelli: 102 of 150) almost 7 in 10 — simulated seasons in which the title is certain after the Mexico City Grand Prix 7% vs 22% — how often the two Italian teams' cars retire, against the rest of the grid
Seeing that Antonelli will win this year's title is easy now, but this model lets us estimate how much of it is down to his Mercedes.
Mansell won with a missile while many considered Senna the best driver on the grid; the same question now hangs over Antonelli.
IF — Is the best car hiding the best driver?
To separate a driver from his car, the only reference point is the teammate: same car, same track. So every driver has two parts in his rating: a driver part that is all his own and a car part he shares with his teammate. The method is the chess Elo rating (a score that rises when you beat someone and falls when you lose, with an average of 1000), extended to a race: every Grand Prix is a series of one-on-one contests between the finishers. How much better or worse a driver does than his teammate is credited to the driver. What the two achieve together is split between car and drivers by a car weight, which the model learns race by race by watching drivers who change team and seasons with new rules. This split varies across the years, and today the car takes about half of the shared result (this is not the same as the three quarters in the verdict or the 60% of the whole grid: the weight says how the shared result is split; the three quarters are the car's part of Antonelli's whole edge, because the Mercedes is far above the average; the 60% is the same idea across the whole grid). So as not to mix up the two kinds of points, from here on I call rating gaps Elo points, and the standings' points championship points.
A retirement does not count, and a disastrous race costs less than a good one earns. Newcomers start below the average and learn faster, as in chess. Ratings carry over from one season to the next, but over the winter technology can turn the grid upside down. So, in the first five races, the model looks at how much the order of the teams has been reshuffled: the more it has changed, the more everyone is pulled back towards the grid average. With new rules, as this year, cars also learn their new level faster. The model has six free parameters, chosen so that it would predict winners equally well in every era from 1983 to 2019. The seasons since 2020 were left out: they are there to test it.
On the chess scale, a gap of 400 Elo points means the stronger side wins ten times in eleven; the average 2026 driver in an average car is worth 1000 (Figure 2a). An average driver in the Mercedes would be rated 1650, in the Ferrari 1501, in the Red Bull 1267. The 149-point gap between Mercedes and Ferrari is more or less like making the Italian team start a game of chess almost a pawn down (a pawn is worth about 200 Elo points). With the car taken out, the strongest is Max Verstappen (1518), then Lando Norris (1453). Next come Oscar Piastri (1299) and Antonelli (1244).
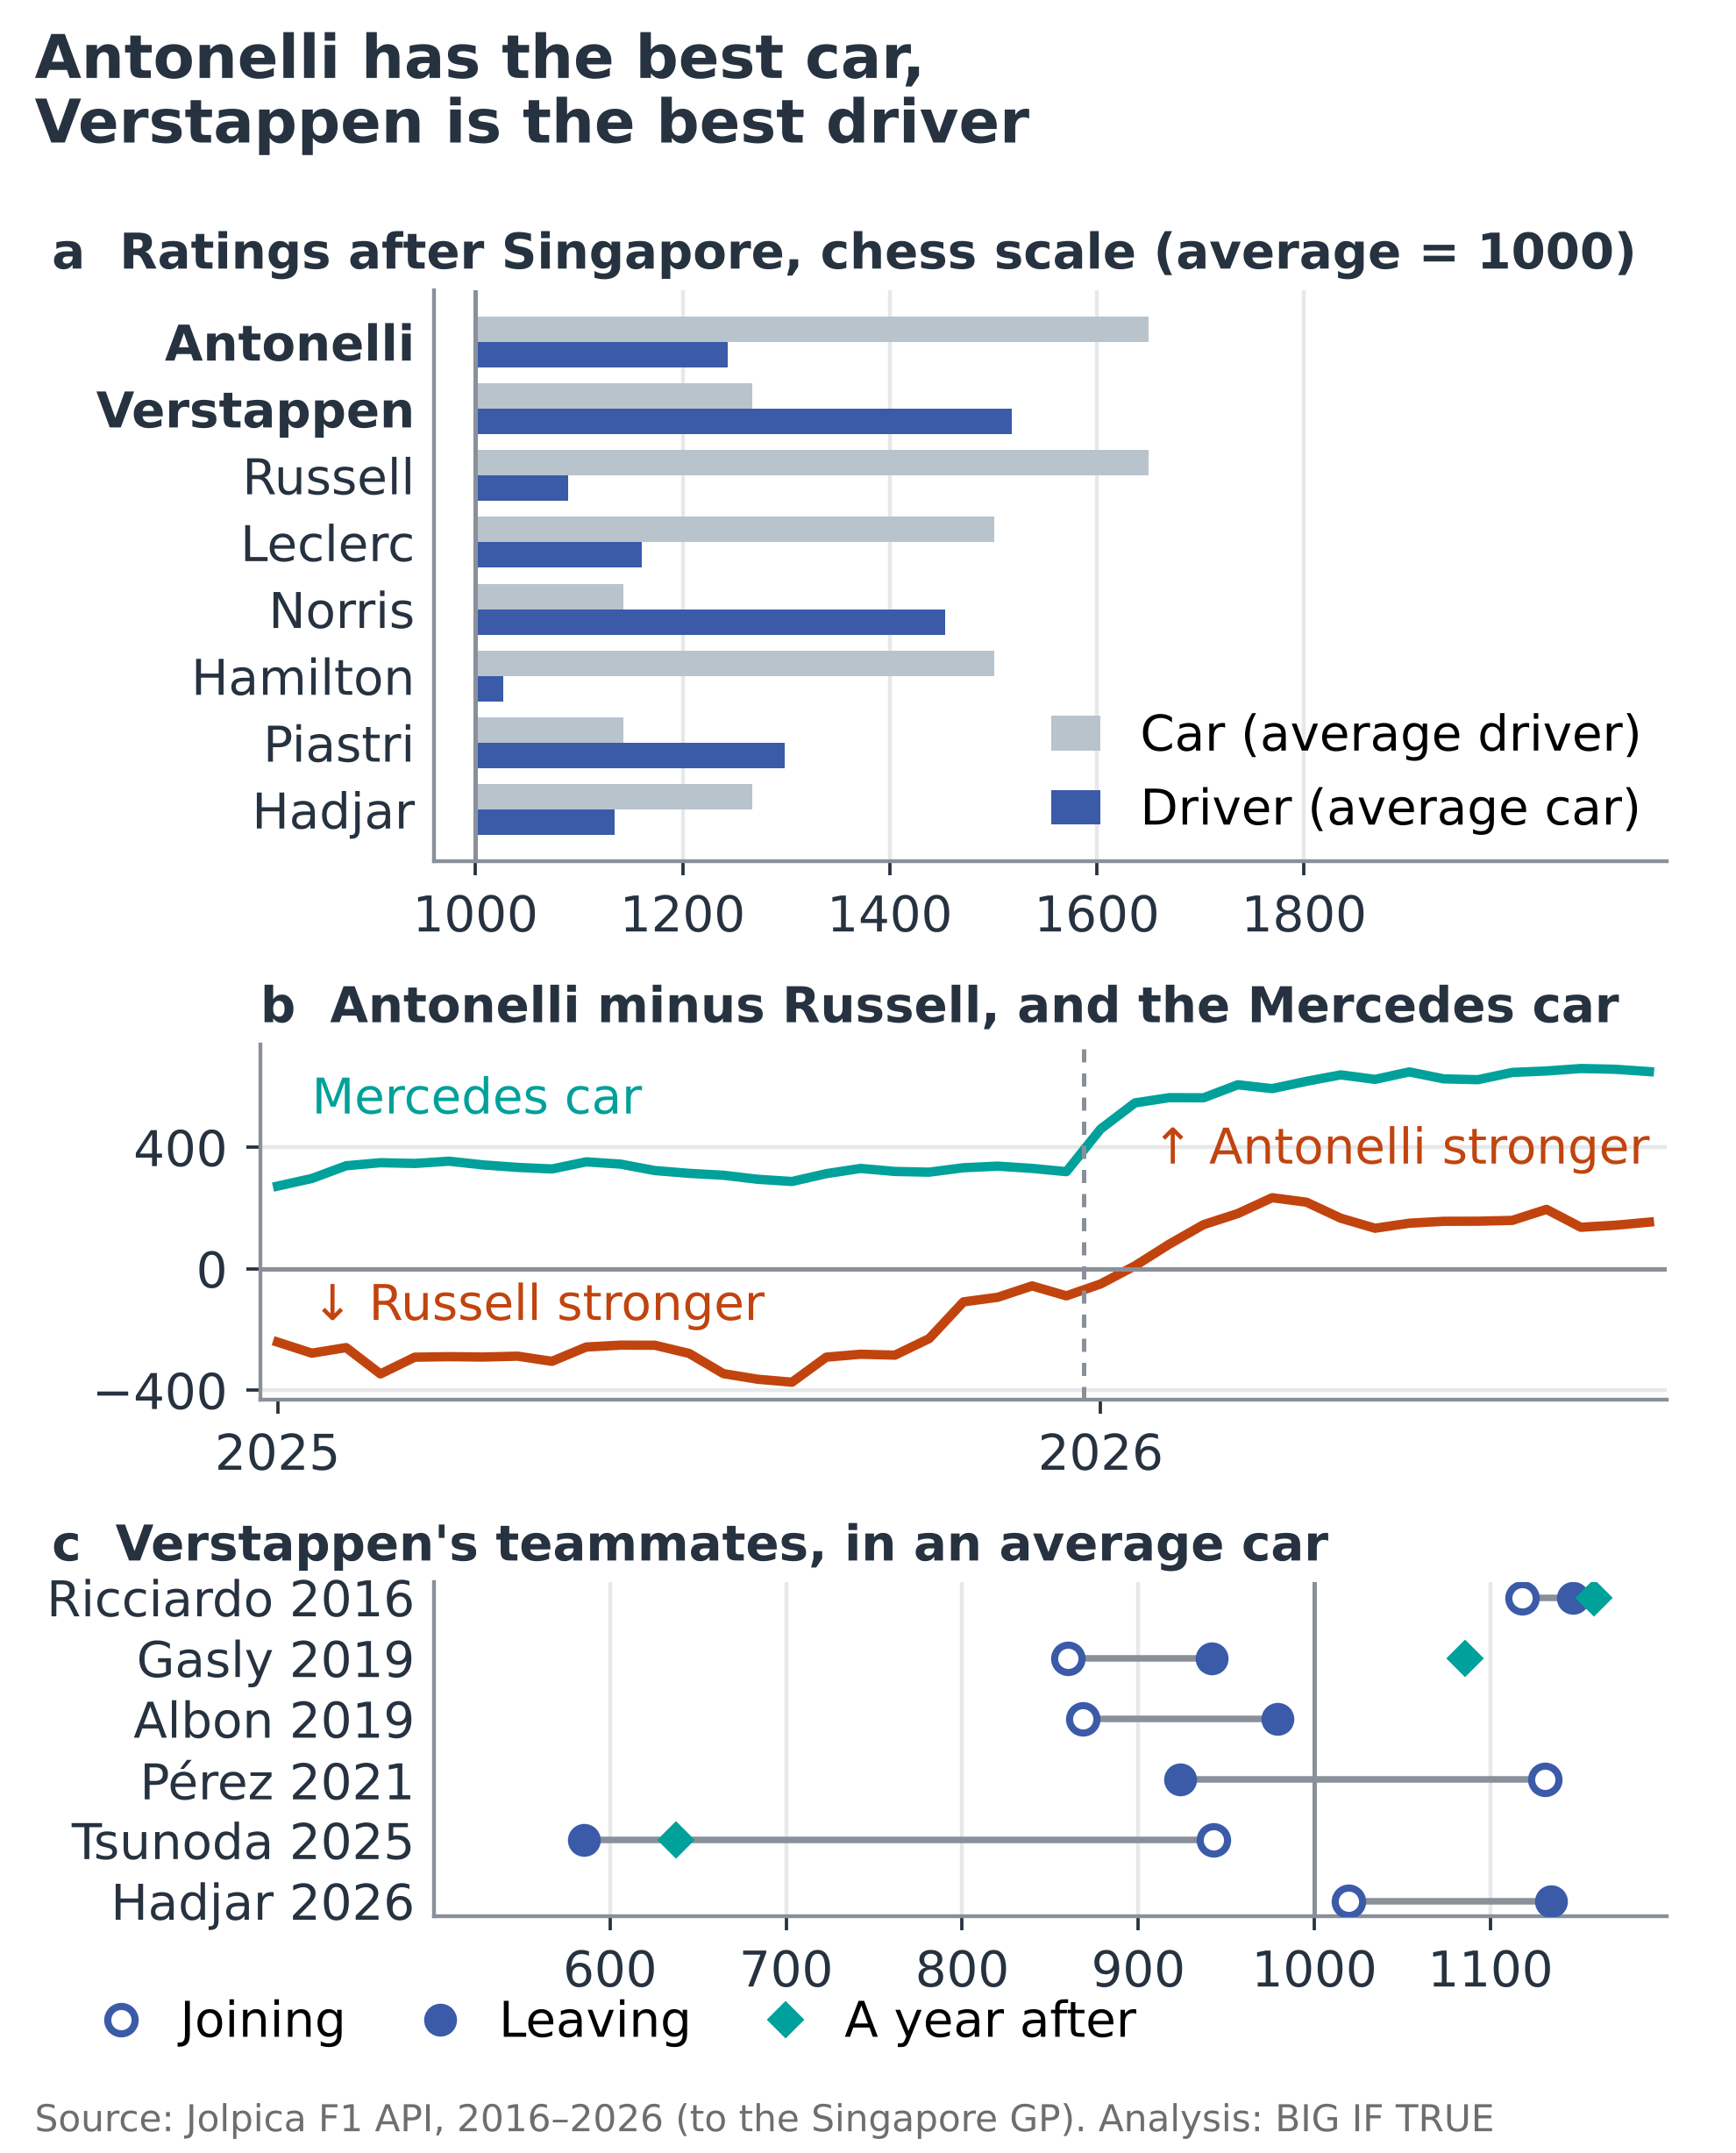
Figure 2. Antonelli has the best car, Verstappen is the best driver. Elo ratings on the chess scale (400 points = ten wins in eleven; the average 2026 driver in an average car = 1000). (a) After Singapore, the top eight in the championship: an average driver in each car (grey) and each driver in an average car (blue). (b) Antonelli's driver part minus Russell's after each Grand Prix of 2025 and 2026; in teal, the Mercedes car's lead over the average car. (c) Verstappen's Red Bull teammates with at least ten races, in an average car: before their first race alongside him, after their last, and a season later.
As a rookie Antonelli finished ahead of Russell in 3 of the 20 races both completed. This year in 9 of 13, and by the second race his driver part had passed Russell's (panel b). Nobody on the grid has changed so fast. Then he levelled off between 1225 and 1290: an exceptional level for a 20-year-old, but still, in chess terms, as if he had almost a pawn and a half fewer on the board than Verstappen.
Here, though, our approach has a clear limit. A team built around one driver makes him look further ahead of his teammate than he really is, and so pushes him up in our measure of the driver. Since 2016 Verstappen has had seven teammates at Red Bull. Panel c follows the six with at least ten races alongside him: their driver part before they arrived, at the end and, for those who kept racing, a season later, away from him. None comes close to his 1518: the highest is Ricciardo, around 1150. Pérez arrives at 1131 and leaves at 924. If it were only a team effect, away from Verstappen his teammates should climb a lot. Gasly climbs (from 942 to 1086), but Ricciardo stays where he was and Tsunoda stays low. And this year Hadjar, alongside him, is rising (from 1019 to 1135). So it is not only a team effect, but the doubt remains: only three raced the season after, each with a different teammate.
THE VERSTAPPEN PARADOX
- Appears most underrated by points: Verstappen, fourth in the standings and the strongest driver once the car is removed.
- Fastest riser: Antonelli, from 89 Elo points below Russell at the end of 2025 to 154 above.
- Moral: a title measures a driver + car pair, and this year about three quarters of Antonelli's edge over the average driver is the Mercedes.
How much to trust it? The best test is whether the ratings predict races they have not seen. The box shows the chance given in advance to the eventual winner, in the 142 races since 2020 for which I found bookmakers' odds published before first practice.
WHO SAW THE WINNER COMING?
Model, 142 Grands Prix 2020–2026 Chance given to the winner Bookmakers 24.0% Our model 23.3% Driver-and-team model (van Kesteren and Bergkamp 2023) 21.0% Plain Elo, one rating per driver (f1elo.com) 20.1% Time-weighted ranking (Henderson and Kirrane 2018) 20.0% Our model, restarted every season 18.3% Points so far this season 16.4% Picking at random 7.4% Each figure is the typical chance (geometric mean over races) that a method gave the actual winner before the race. Bookmakers price only some drivers, so every method is scored on those same drivers. Every model was tuned on races before 2020. Plain Elo is f1elo.com's method rebuilt on our data: after Singapore it gives the same ratings as the site, within 40 Elo points.
The bookmakers do better still: 24.0% against 23.3%, and personally I would not bet using my model: betting firms keep a wide margin and know the details that come before every race. But the model predicts the whole grid, not just the winner. If we compare the championship points the model expects from each driver in each race since 2020 with the points actually scored, it is off by 3.2 on average: less than any other method in the box (points so far this season are off by 3.8; giving everyone the average, by 5.8).
WHAT THE LITERATURE SAYS The closest peer-reviewed work is van Kesteren and Bergkamp (2023): on the finishing positions of 2014–2021 they find that about 88% of the variation comes from the constructor, and their best drivers are Hamilton and Verstappen. Our car share (57% since 2014, explained further on) is lower because it measures the gaps between drivers, not every position down to the back of the grid. Rebuilt as a forecast, their model picks winners less well than ours (21.0% against 23.3%) but orders the whole grid better, in one-on-one comparisons down to the back.
TRUE — How much the car counts, since 1950
Every rating says how far a driver is from the average. Part of that gap is the car, part is the driver. Antonelli is far above the average, but about three quarters of his edge is down to his Mercedes. Verstappen's edge, on the other hand, is one third the car's and two thirds his own. If we do the same sum for all drivers at once, race after race (Figure 3a), we get the car share for the whole grid. In the 1970s the car counted for about a third, and the driver for the other two thirds. The peak comes in the early 2000s, with Schumacher's Ferrari: almost 70% in 2003. Since 2000 the car has counted for 59% on average, against 41% between 1950 and 1989. This year 60%, the highest value since 2016.
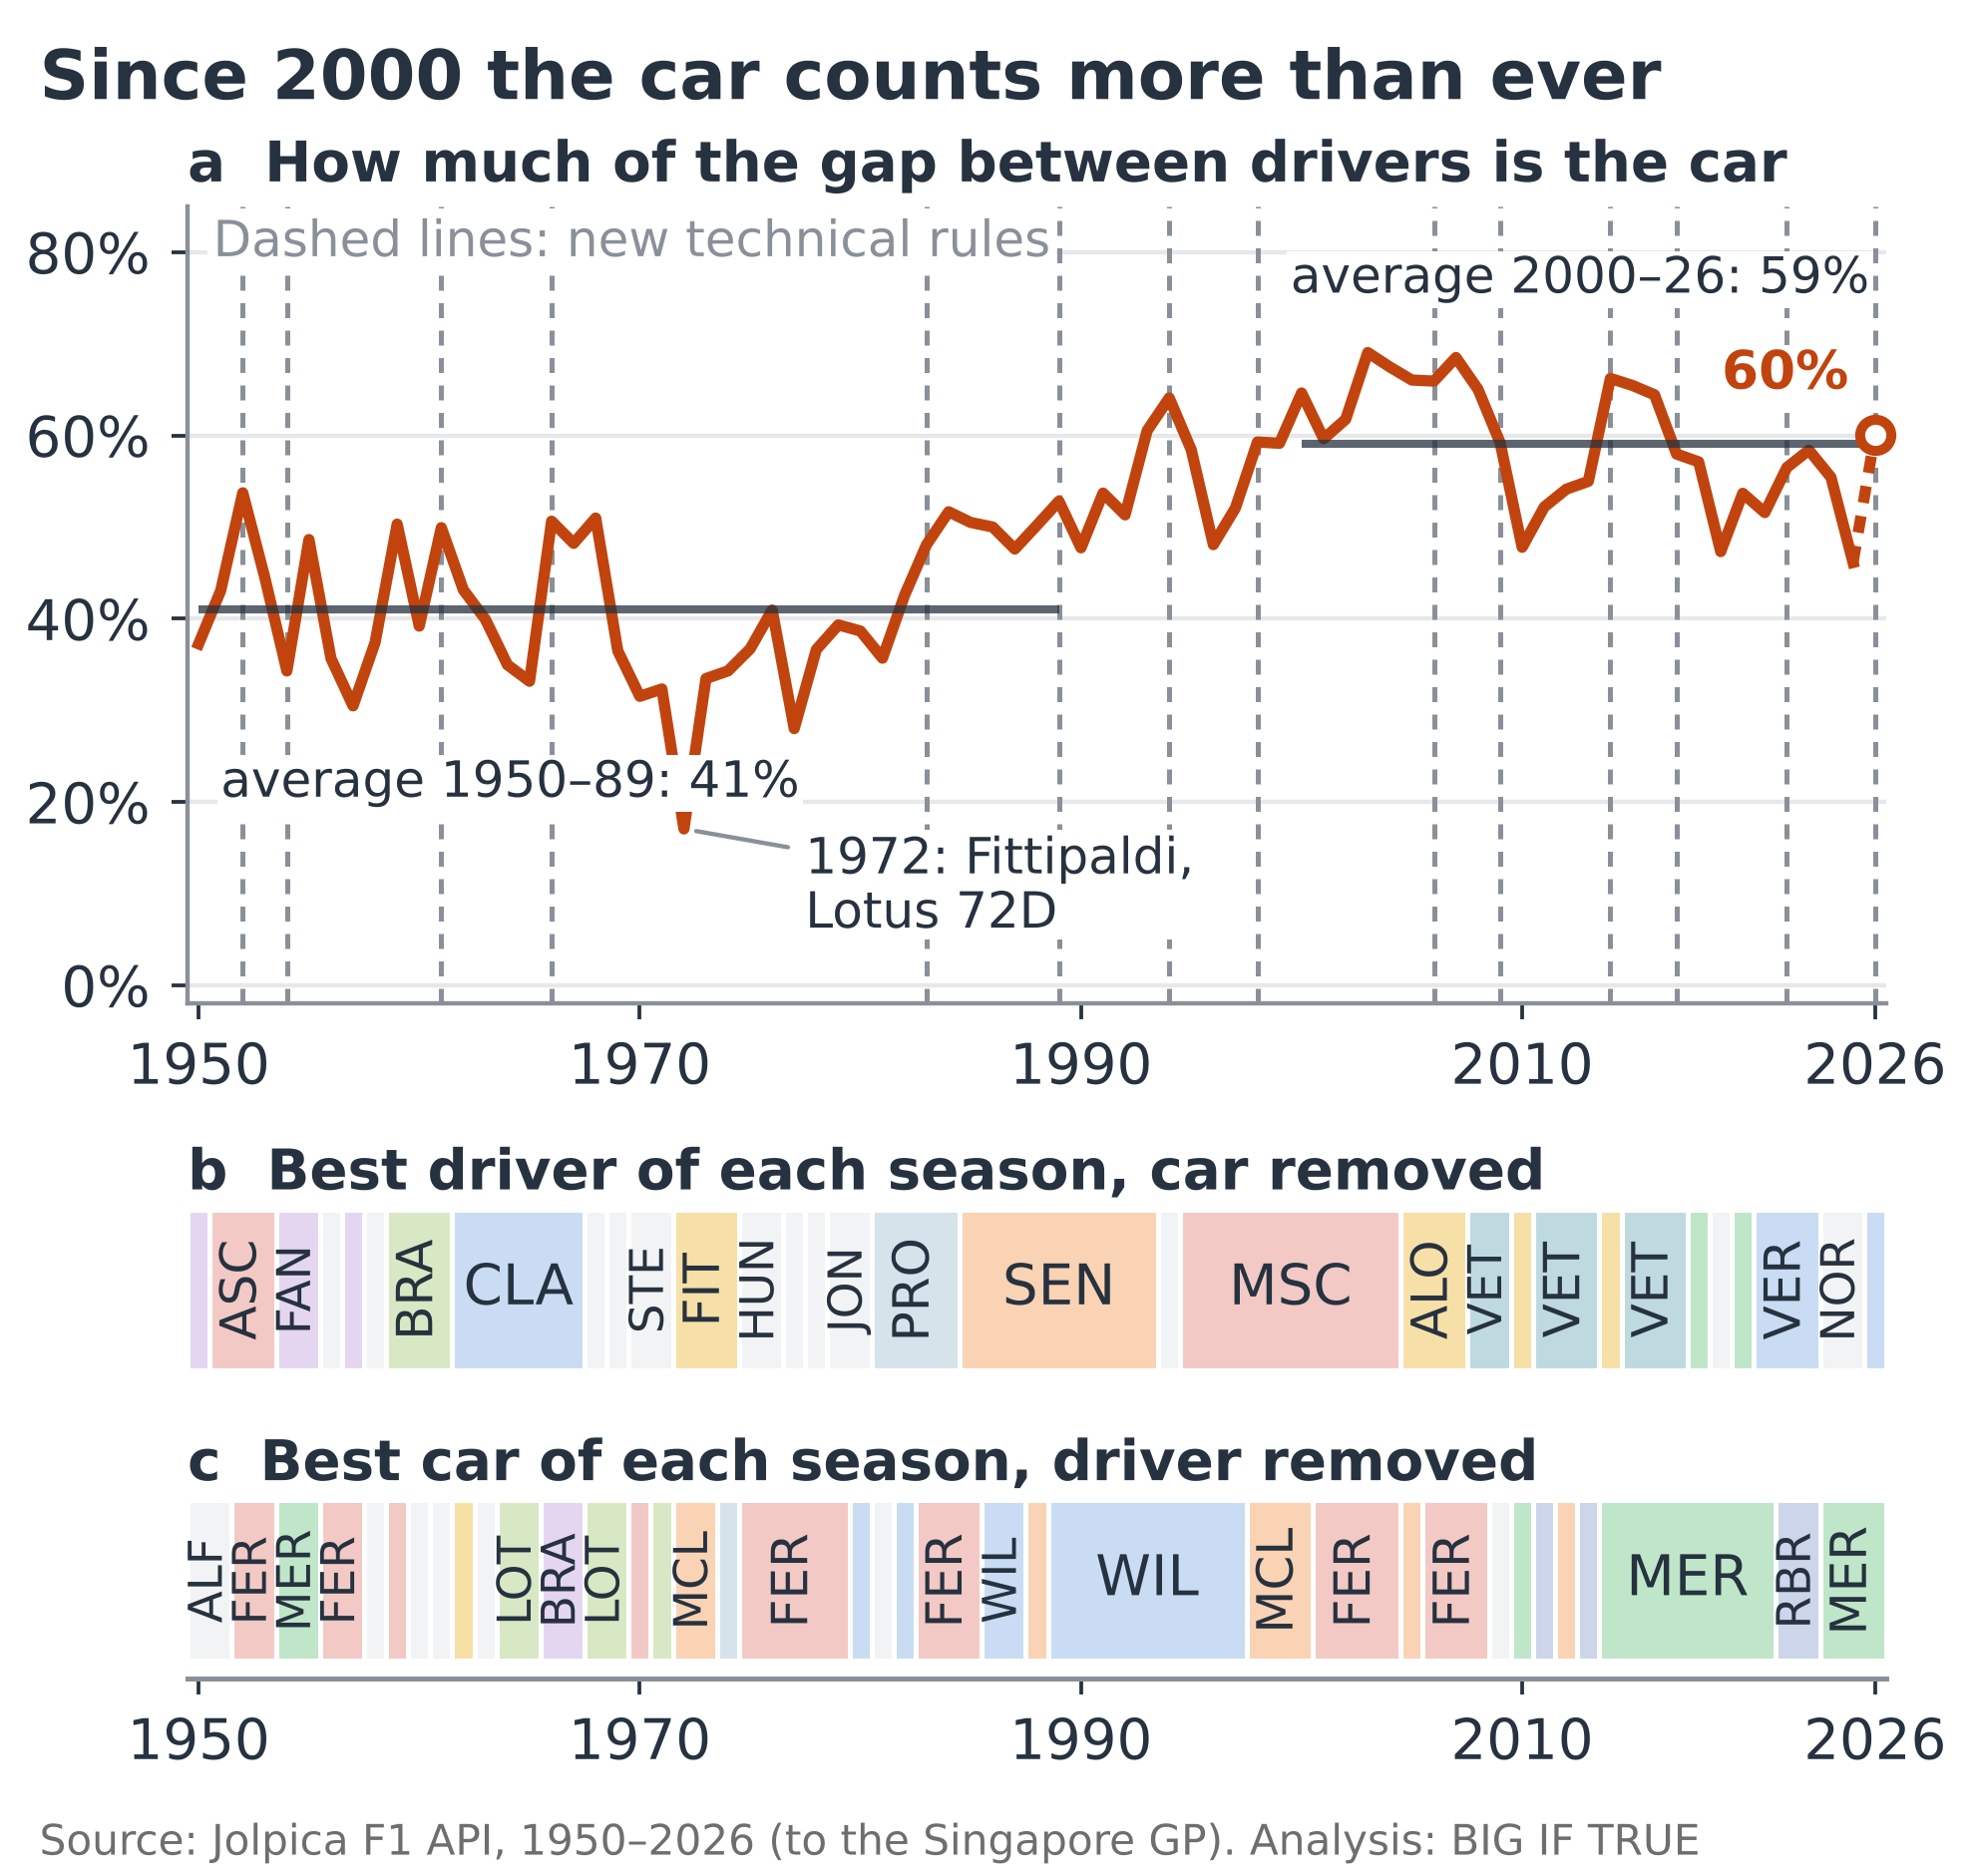
Figure 3. Since 2000 the car counts more than ever. (a) How much of the gap between each driver and the average is the car, season by season (2026: after 17 of 23 races, dotted); drivers far from the average count more. Dashed: technical-rule changes. Horizontal lines: the average for 1950–1989 (41%) and for 2000–2026 (59%). (b) The driver with the highest driver part at the end of each season. (c) The car with the highest car part at the end of each season (not the constructors' champion). Three-letter codes for the driver or the team.
The lowest point comes in 1972. Fittipaldi won the title in the legendary Lotus 72D, one of the great cars of its time. But that year his teammates did not score a single point. So the model hands almost all of Lotus's results to Fittipaldi, and almost none to the car. It is the clearest case of what the method cannot see: when a team is built around one driver, he looks stronger than he is, and the car weaker.
The best driver once the car is removed (panel b) reads like a history of the sport: Fangio and Ascari, Clark, Stewart, Prost, Senna, Schumacher, Alonso, Vettel, Hamilton and Verstappen, with Norris ahead of everyone in 2024 and 2025. The best cars, with the driver removed (panel c), do the same: the 1960s Lotus, Ferrari in the late 1970s, Williams from 1989 to 1997, Schumacher's Ferrari, Mercedes from 2014 to 2021 and again since 2024. In 1992 the model puts the Williams just ahead of the Benetton, even though Williams won the constructors' title comfortably, by 65 points: Mansell clearly beat his teammate Patrese, and the model gives him part of the rocket's advantage. With the car removed, Mansell still ends up just behind Senna.
A caveat, though: the best car, once the driver is removed, is not always the one that wins the constructors' title. Since 1958, the first year of that title, the two agree 39 times out of 68. The title adds up both drivers' points; panel c removes the drivers, and looks at the car after the last race. So McLaren won in 2024 and 2025, even though at the end of each year the model rates the Mercedes as stronger.
Separating driver and car perfectly is impossible. We would need to put Verstappen in Antonelli's Mercedes, and Antonelli in Verstappen's Red Bull, for a whole season. The model does the closest thing the data allow: it watches who shares the same car, and who changes team. That is why it struggles with drivers who have never changed team: Norris and Piastri, for example, have never raced anywhere else.
That 60% could still move, with six races to go, but it is not down to the surprise Antonelli is giving us: without him the share drops a little (58%), without both Mercedes to 54%. With or without the Mercedes, and with a 20-year-old almost-champion, under the new rules 2026 is a season of cars.
THE NUMBERS 60% — the share of the gap between drivers that is the car in 2026, across the whole grid: according to the model, the highest since 2016 69% — the same share in 2003, the highest since 1950 (Schumacher's Ferrari) about a third — the same share in the 1970s 17% — the same share in 1972, the lowest since 1950 (Fittipaldi and the Lotus 72D)
For anyone interested, the path of every driver and every car, race by race since 1950, can be explored on an interactive page. It is not the only one online. A fine project on GitHub, with its own interactive page, separates driver and car by a different road, qualifying times since 2018: there too Verstappen is the fastest in equal machinery, and 2026 is a year of cars.
In the last issue I got curious about how the format of tournaments and championships shapes the chance that the strongest wins (here). This week I tried, with Claude, something similar but different on Formula 1. These models, and my approach, have clear limits. Picture me on the sofa talking with the AI (today Claude), suggesting approaches and data sources, and critically assessing the results.
As a fan, I would have hoped to see Antonelli already on top of every possible statistical indicator, but he is not there yet. Antonelli is exceptional, but he is not an alien like Verstappen: his driver part has levelled off (between 1225 and 1290 since the fourth race). But the "alien" is also an effect of how the model is built: it measures the gap to the teammate, and Red Bull has a clear hierarchy between first and second driver, which pushes the Dutch champion up in our measure of the drivers. Still, there must be a reason Verstappen has his own song, which a few weekends ago I caught myself singing without even noticing…
What I write should be read with the same critical spirit, as I explain in a short manifesto. And anyone interested can check what was done, and improve it, by exploring the repository.
What it is and what it is not
- Finishing order only. No lap times, qualifying, tyres or weather. The split rests on teammates: a team built around one driver inflates him and deflates the other (Lotus in 1972). Before the 1980s the data put works teams and privateers under the same constructor, and the split is weaker.
- A season and a half. 2026 is incomplete (17 of 23 races) and Antonelli's driver part is among the most uncertain of the top eight in the championship: he has few races behind him.
- The chess scale. Gaps compare with chess, levels do not: the average here is a Formula 1 driver. A pawn is worth about 200 points: by Kaufman's estimates it is less for a club player (about 100) and more for Carlsen (about 300).
- The car share. This is the number behind the 60% and Figure 3. In every race I measure how much of the rating differences between drivers goes together with the differences between their cars, across all the races of the season (technically: the covariance between car part and total rating, divided by the variance of the total). It is not the share of wins that are due to the car. Measured another way, how much the car helps to pick the winner, 2026 is similar (between 60% and 64%), but the peak moves to 2015 (about 70%) and 2026 is no longer the highest since 2016 (2018 beats it): the ranking of years depends on this choice. With neither measure, on the other hand, does Verstappen lose first place among the drivers.
- Rookies and new teams. They start 350 Elo points below the average driver (new teams below the average car) and move twice as fast for their first 30 races: a fixed choice, made after seeing the results. Starting them at zero, as at first, put newcomers further below the field as the years went by: Cadillac, this year's new team, ended up more than a thousand Elo points below Aston Martin, while the 2026 finishing order alone puts it just over 200 Elo points behind. With the fixed start it is last, about 340 points behind Aston Martin, and past races are predicted slightly better.
- Choices made after seeing results. The six settings are tuned on races up to 2019, and every prediction uses only earlier results. But several choices also looked at 2020–2026 (the full list is in the cards on the table, below). That makes the model look slightly more accurate than it is: the versions left out predicted almost as well. The simulations treat every rating as exact, so favourites come out slightly too sure.
- Scope. World championship Grands Prix and sprints only (the Indianapolis 500 counts for 1950–1960). Title odds are recalculated from 1991, the first year in which every result counts (before, the worst ones were dropped).
BIT — CARDS ON THE TABLE
- Model and code. Every step, from downloading the results to the ratings, the simulations, the comparisons with other methods and with the odds, and the charts, was written and run by Claude Opus 5.5 (Anthropic), working from my instructions. Claude Sonnet agents, with a fixed protocol, read the race reports on Wikipedia and collected the historical odds. I set the questions and the approach; the models did the work.
- The six free parameters, tuned on 1983–2019 races. (1) Step, 132 on the model's internal scale: a driver who wins beating everyone, when he was level with them, gains about 128 Elo points on the chess scale. (2) How fast the car weight learns, 0.13. (3) Reshuffle pull, 0.45: if at the start of a season the team order has nothing left in common with the winter's, ratings lose just under half of their distance from the average. (4) Forecast scale, 207: how much a rating gap weighs on the chance of winning the race (learning uses the fixed chess scale, 400 instead); to show them on the chess scale the ratings are multiplied by 400/207, almost double. (5) Cap on disastrous races, 0.019: a terrible race costs at most about 5 Elo points on the chess scale. (6) Speed-up with new rules, 5.7: at the first race cars learn 6.7 times faster (1 + 5.7), and the effect fades over the next five races.
- Usage. The analysis and writing chat used about 130 million effective tokens: Claude Opus 5.5 about 105 million, Claude Sonnet 5.5 agents 16 million, Claude Haiku 9 million. About three quarters come from the chat re-reading and storing its own history at every reply; less than a fifth is text the models wrote. Editing work in other chats is not included. What was counted is in the repository.
- Changes made after seeing results. Data from 1950 instead of 1990; every rule change since 1952; tuning every era equally; faster learning for newcomers; the speed-up with new rules; the damping of disastrous races; a car weight learned race by race; a pull over the first five races instead of a winter cut; the car share measured on the gaps instead of on the winner; a fixed start for rookies and new teams, 350 Elo points below the average.
- Bugs found and fixed along the way. Sixteen in the code and data, plus six sentences or numbers in the text corrected in the final check. All found before publication. The full list is in the repository. I cannot promise none are left.
- Data sources. Results 1950–2026 from the Jolpica F1 API (Ergast-compatible; CC BY-NC-SA 4.0). Race reports from English Wikipedia (CC BY-SA 4.0). Chess probabilities: Larry Kaufman's estimates in New in Chess (January 2024), as reported by Wikipedia. Odds 2020–2026 from articles published before first practice, mostly formula1.com's guides; every source is in the repository.
- Peer-reviewed work on the same subject. van Kesteren, E.-J., & Bergkamp, T. (2023), Journal of Quantitative Analysis in Sports 19(4), 273–293, doi:10.1515/jqas-2022-0021. Bell, A., Smith, J., Sabel, C. E., & Jones, K. (2016), Journal of Quantitative Analysis in Sports 12(2), 99–112. Henderson, D. A., & Kirrane, L. J. (2018), Bayesian Analysis 13(2), 335–358.
- Code and data. github.com/bigiftruebits/bit-003-f1-elo, every rating since 1950 on the interactive page; archived at 10.5281/zenodo.23559556.
- How to cite. This is not a peer-reviewed publication. If you need to reference it, cite the archived code and data: Gallotti, R. (2026). BIG IF TRUE #003: Who is winning F1, Kimi Antonelli or his Mercedes? I analysed every Grand Prix since 1950 to find out [Code and data]. Zenodo. 10.5281/zenodo.23559556
The comparison with the bookmakers shows how good their models are; it is not advice: nothing here invites you to bet, and if you do, stake only what you can afford to lose.
I would rather someone found a mistake than that nobody looked. Code and data are open, and published with every issue.