#001 Southern Europe has stopped cooling down at night
Two indicators of night-time heat for June–August, 2020–2025 against 1980–1989: the share of summer months with a tropical average night, and the hours of relief among the eight coldest hours of the day. Also in Italian: L'Europa meridionale ha smesso di rinfrescarsi di notte.
Read the articleLeggi in italianoSubscribe on Substack
Figures
Click an image for full resolution.
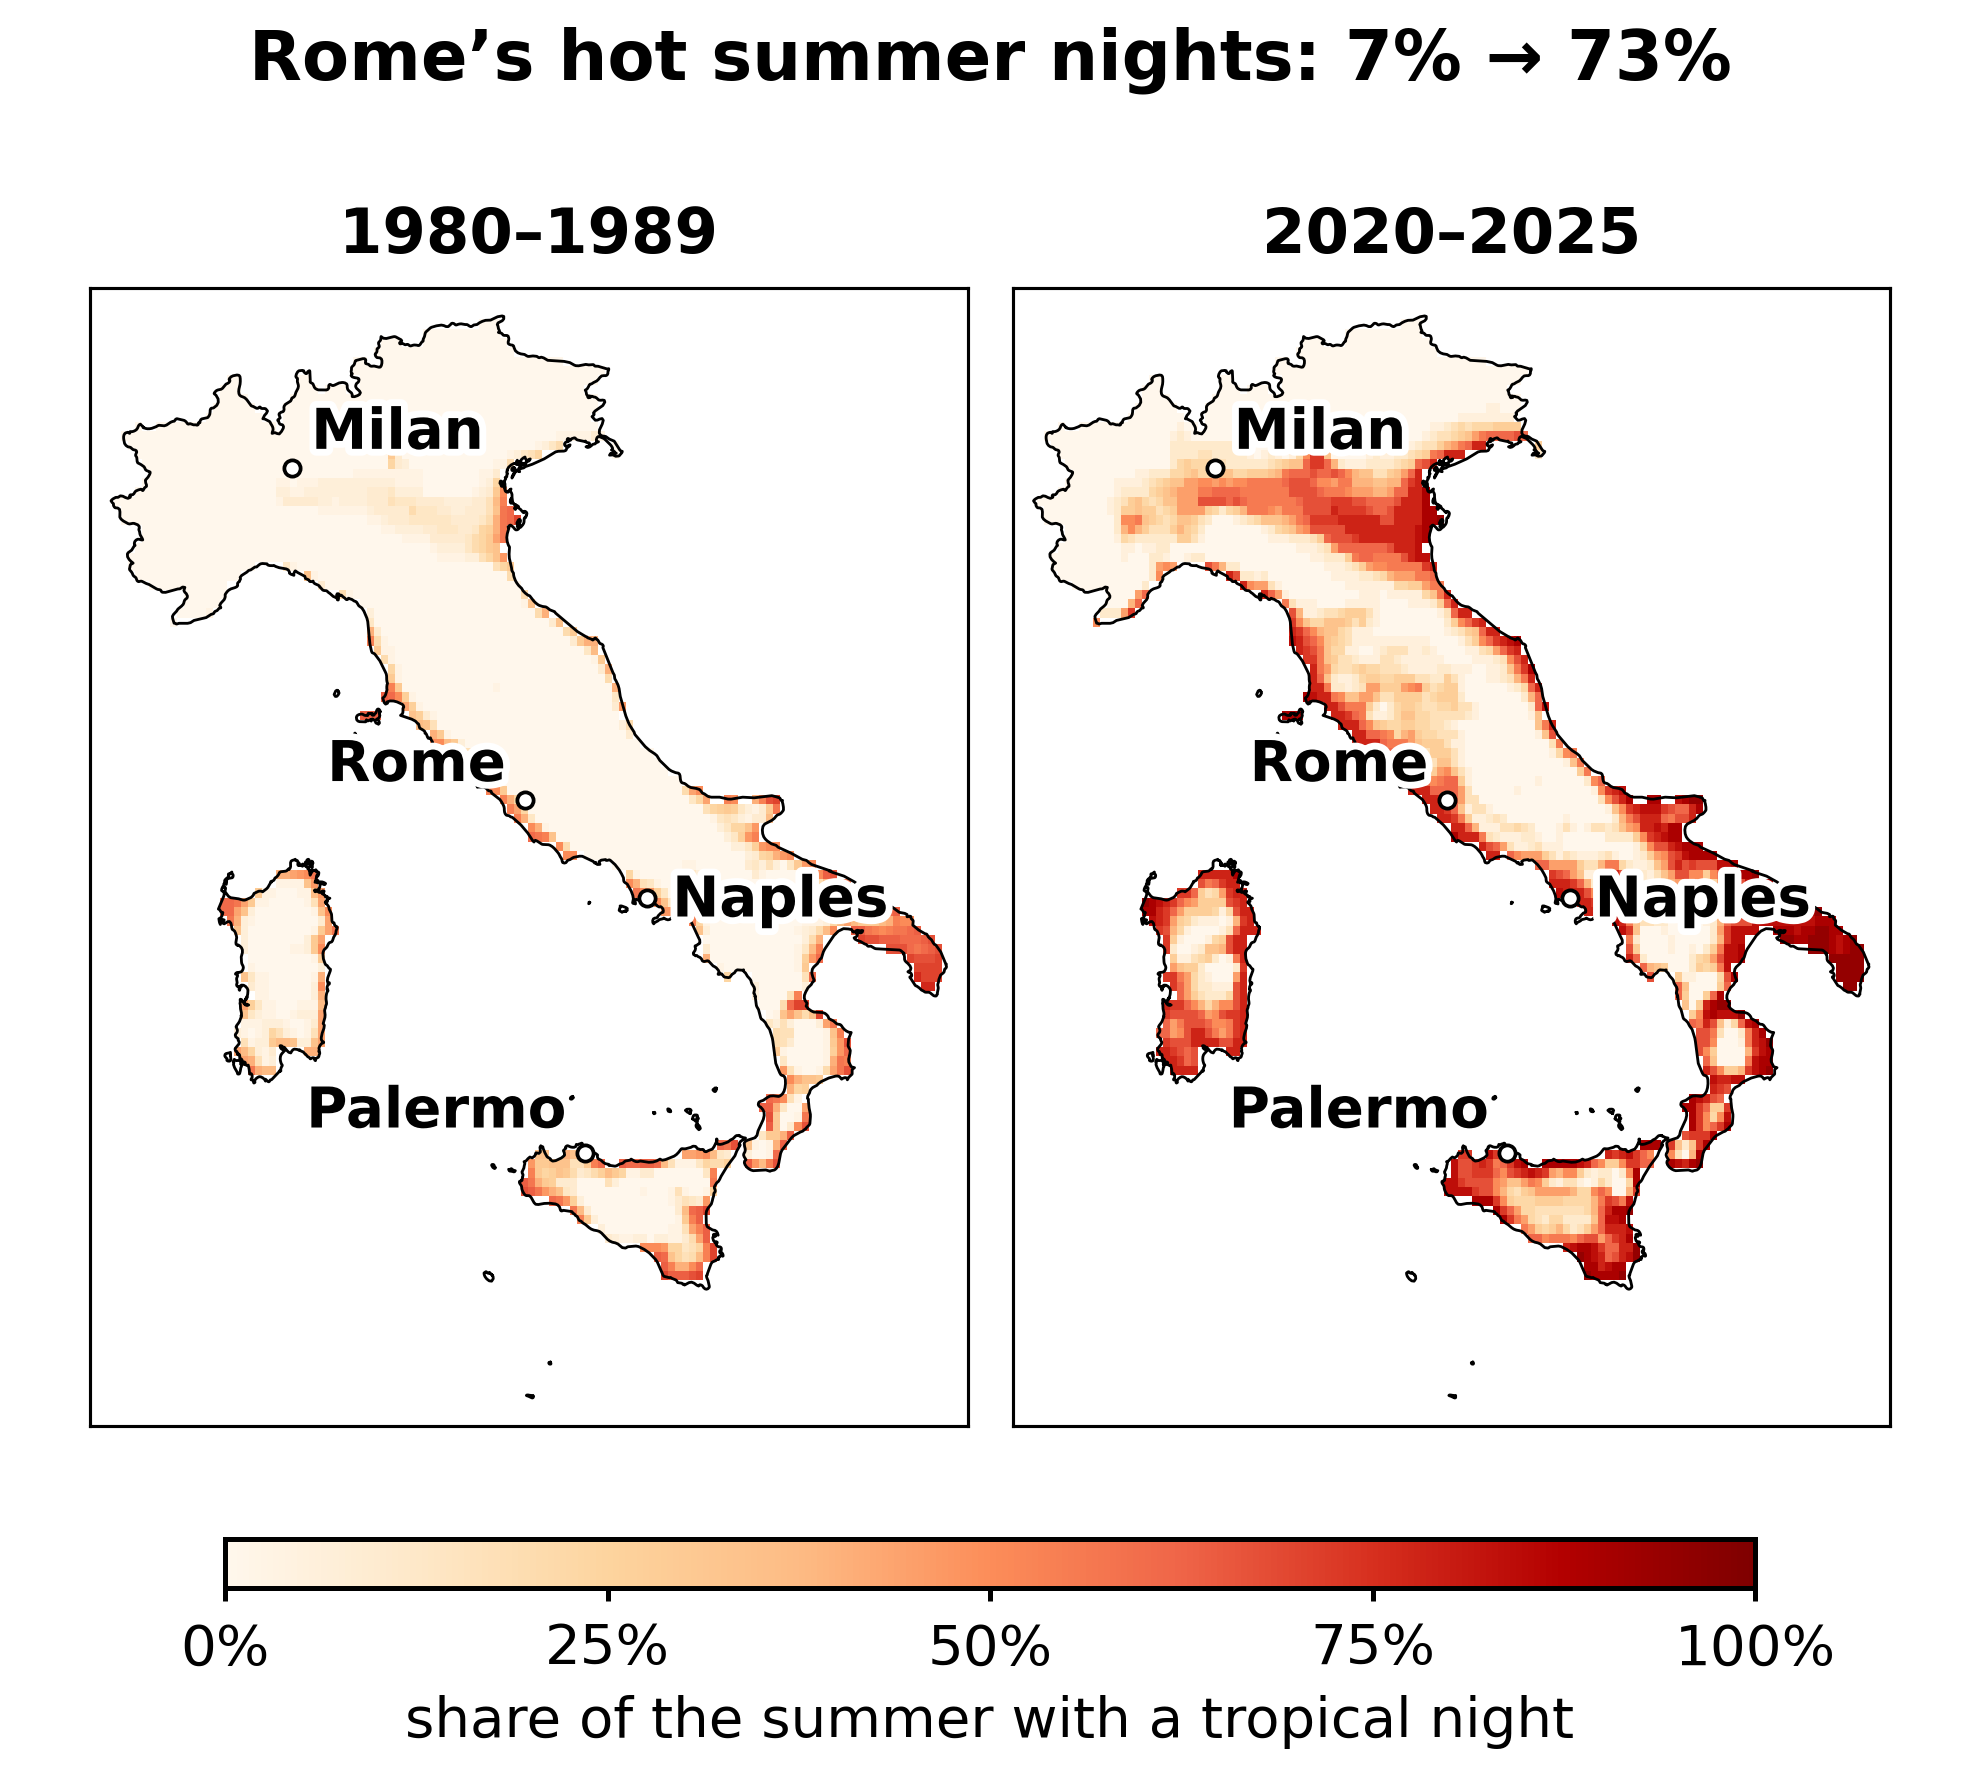
make_fig1.py.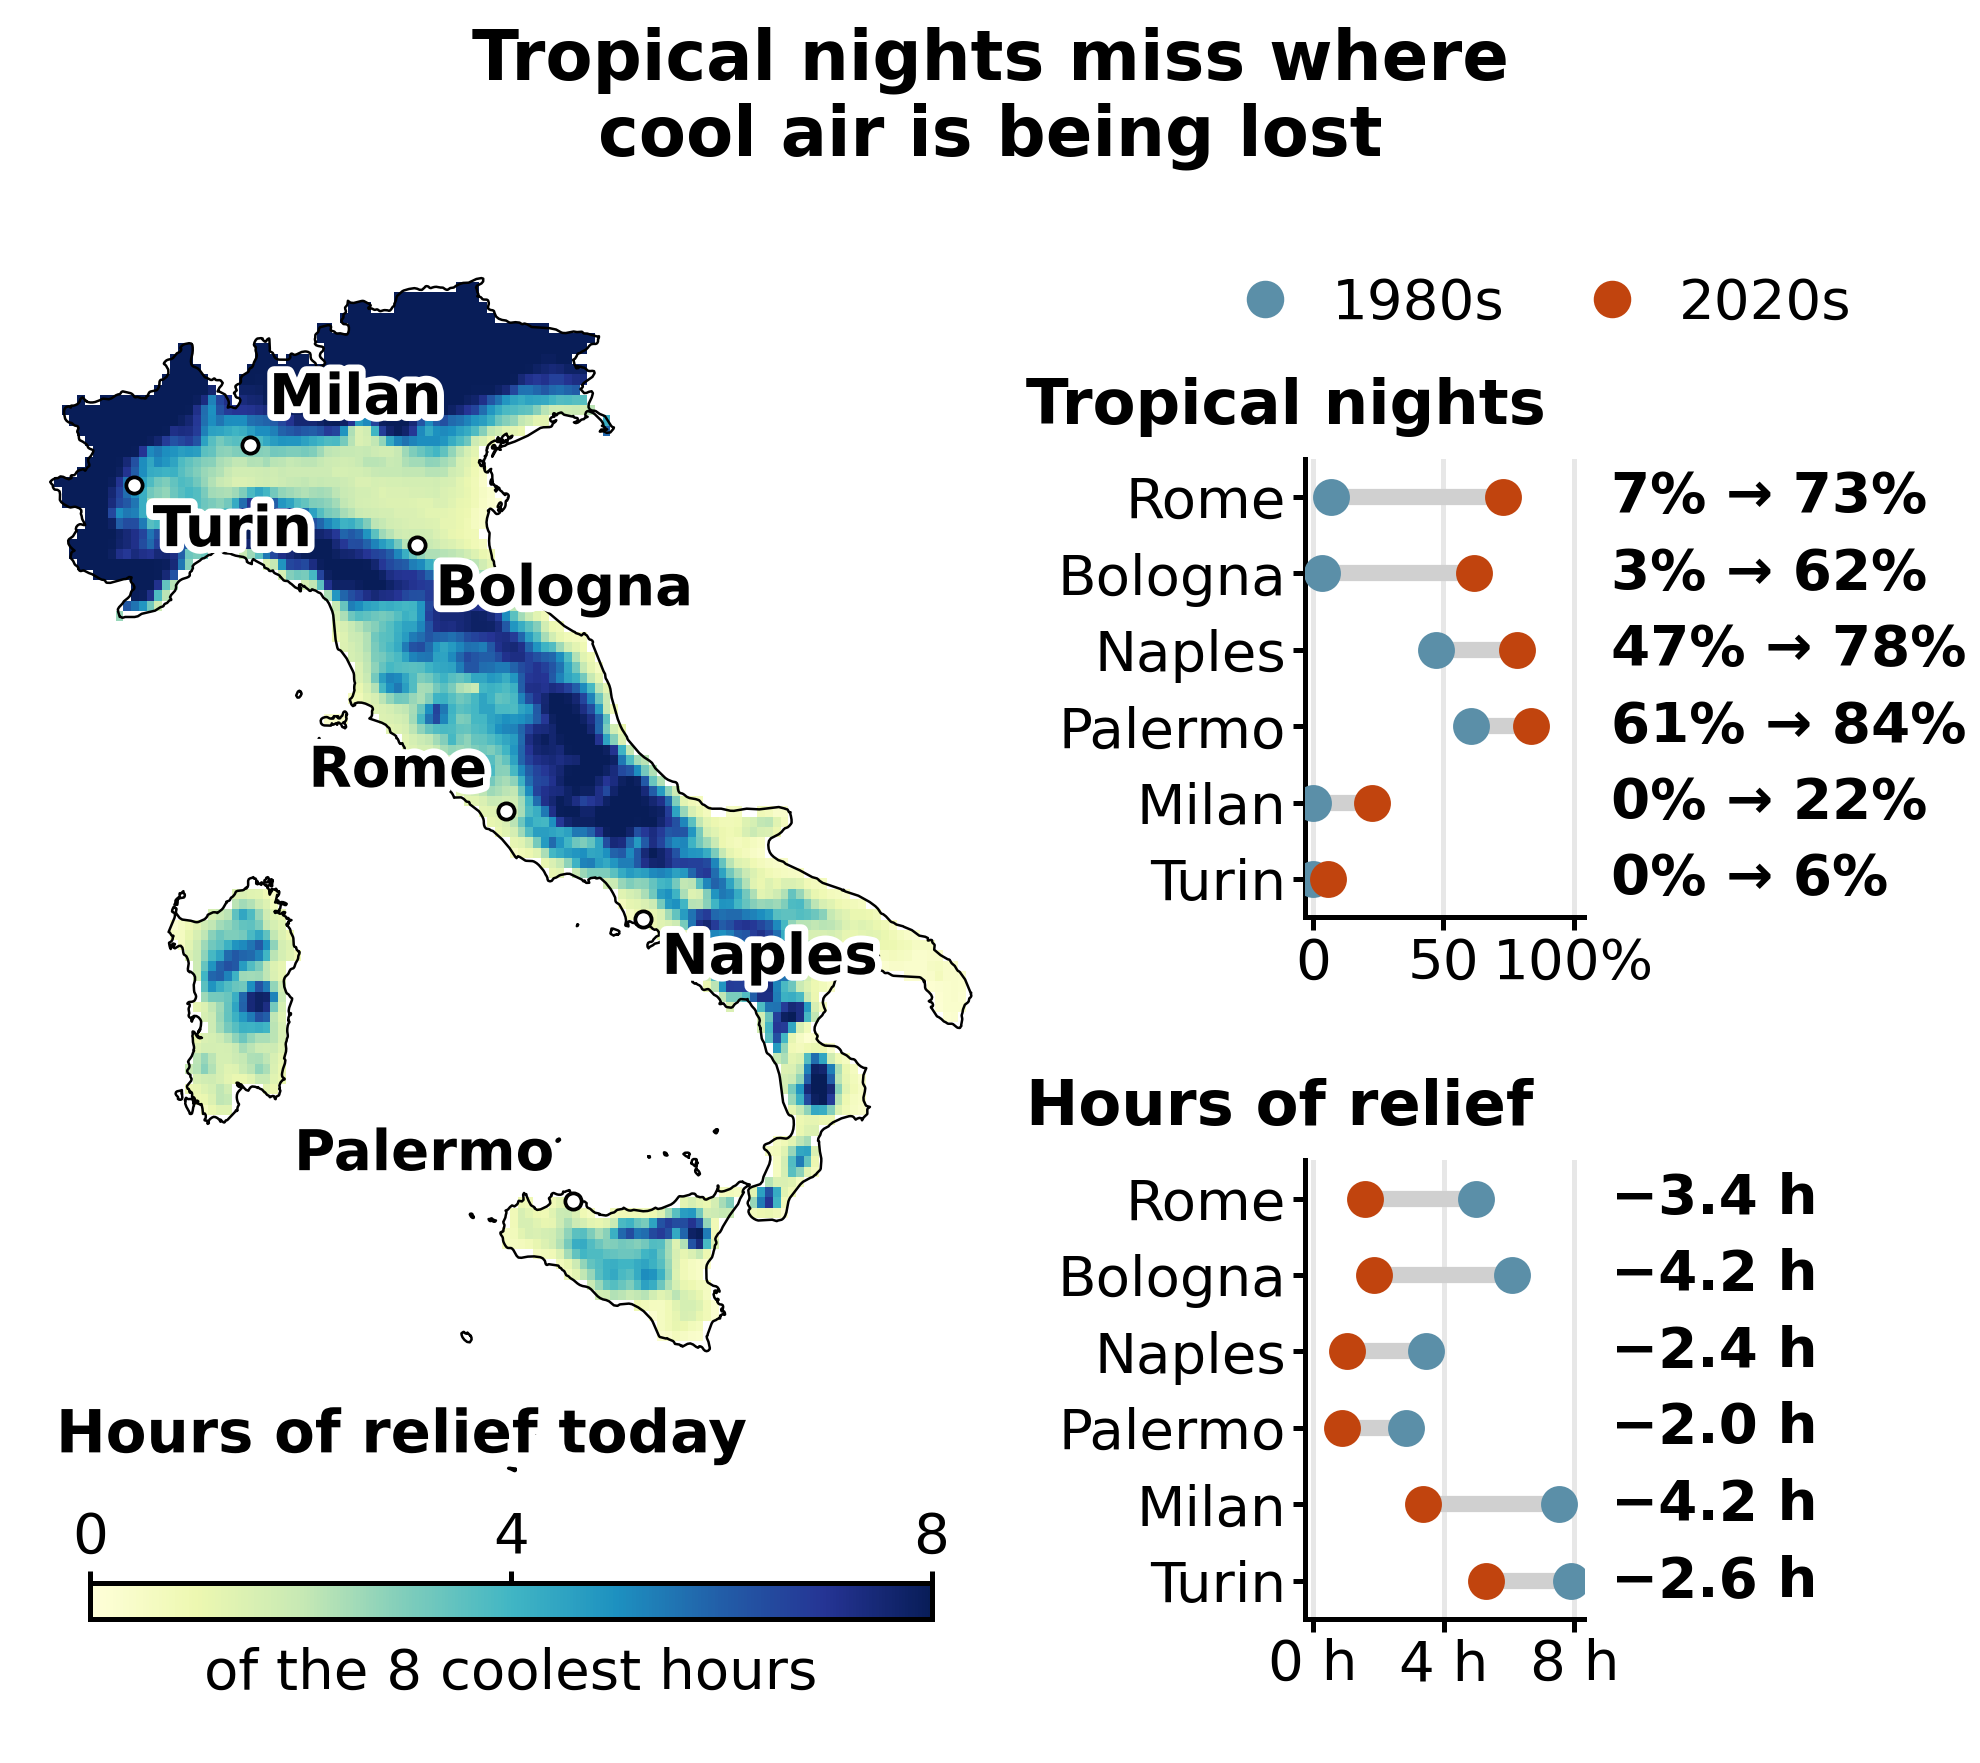
make_fig2.py.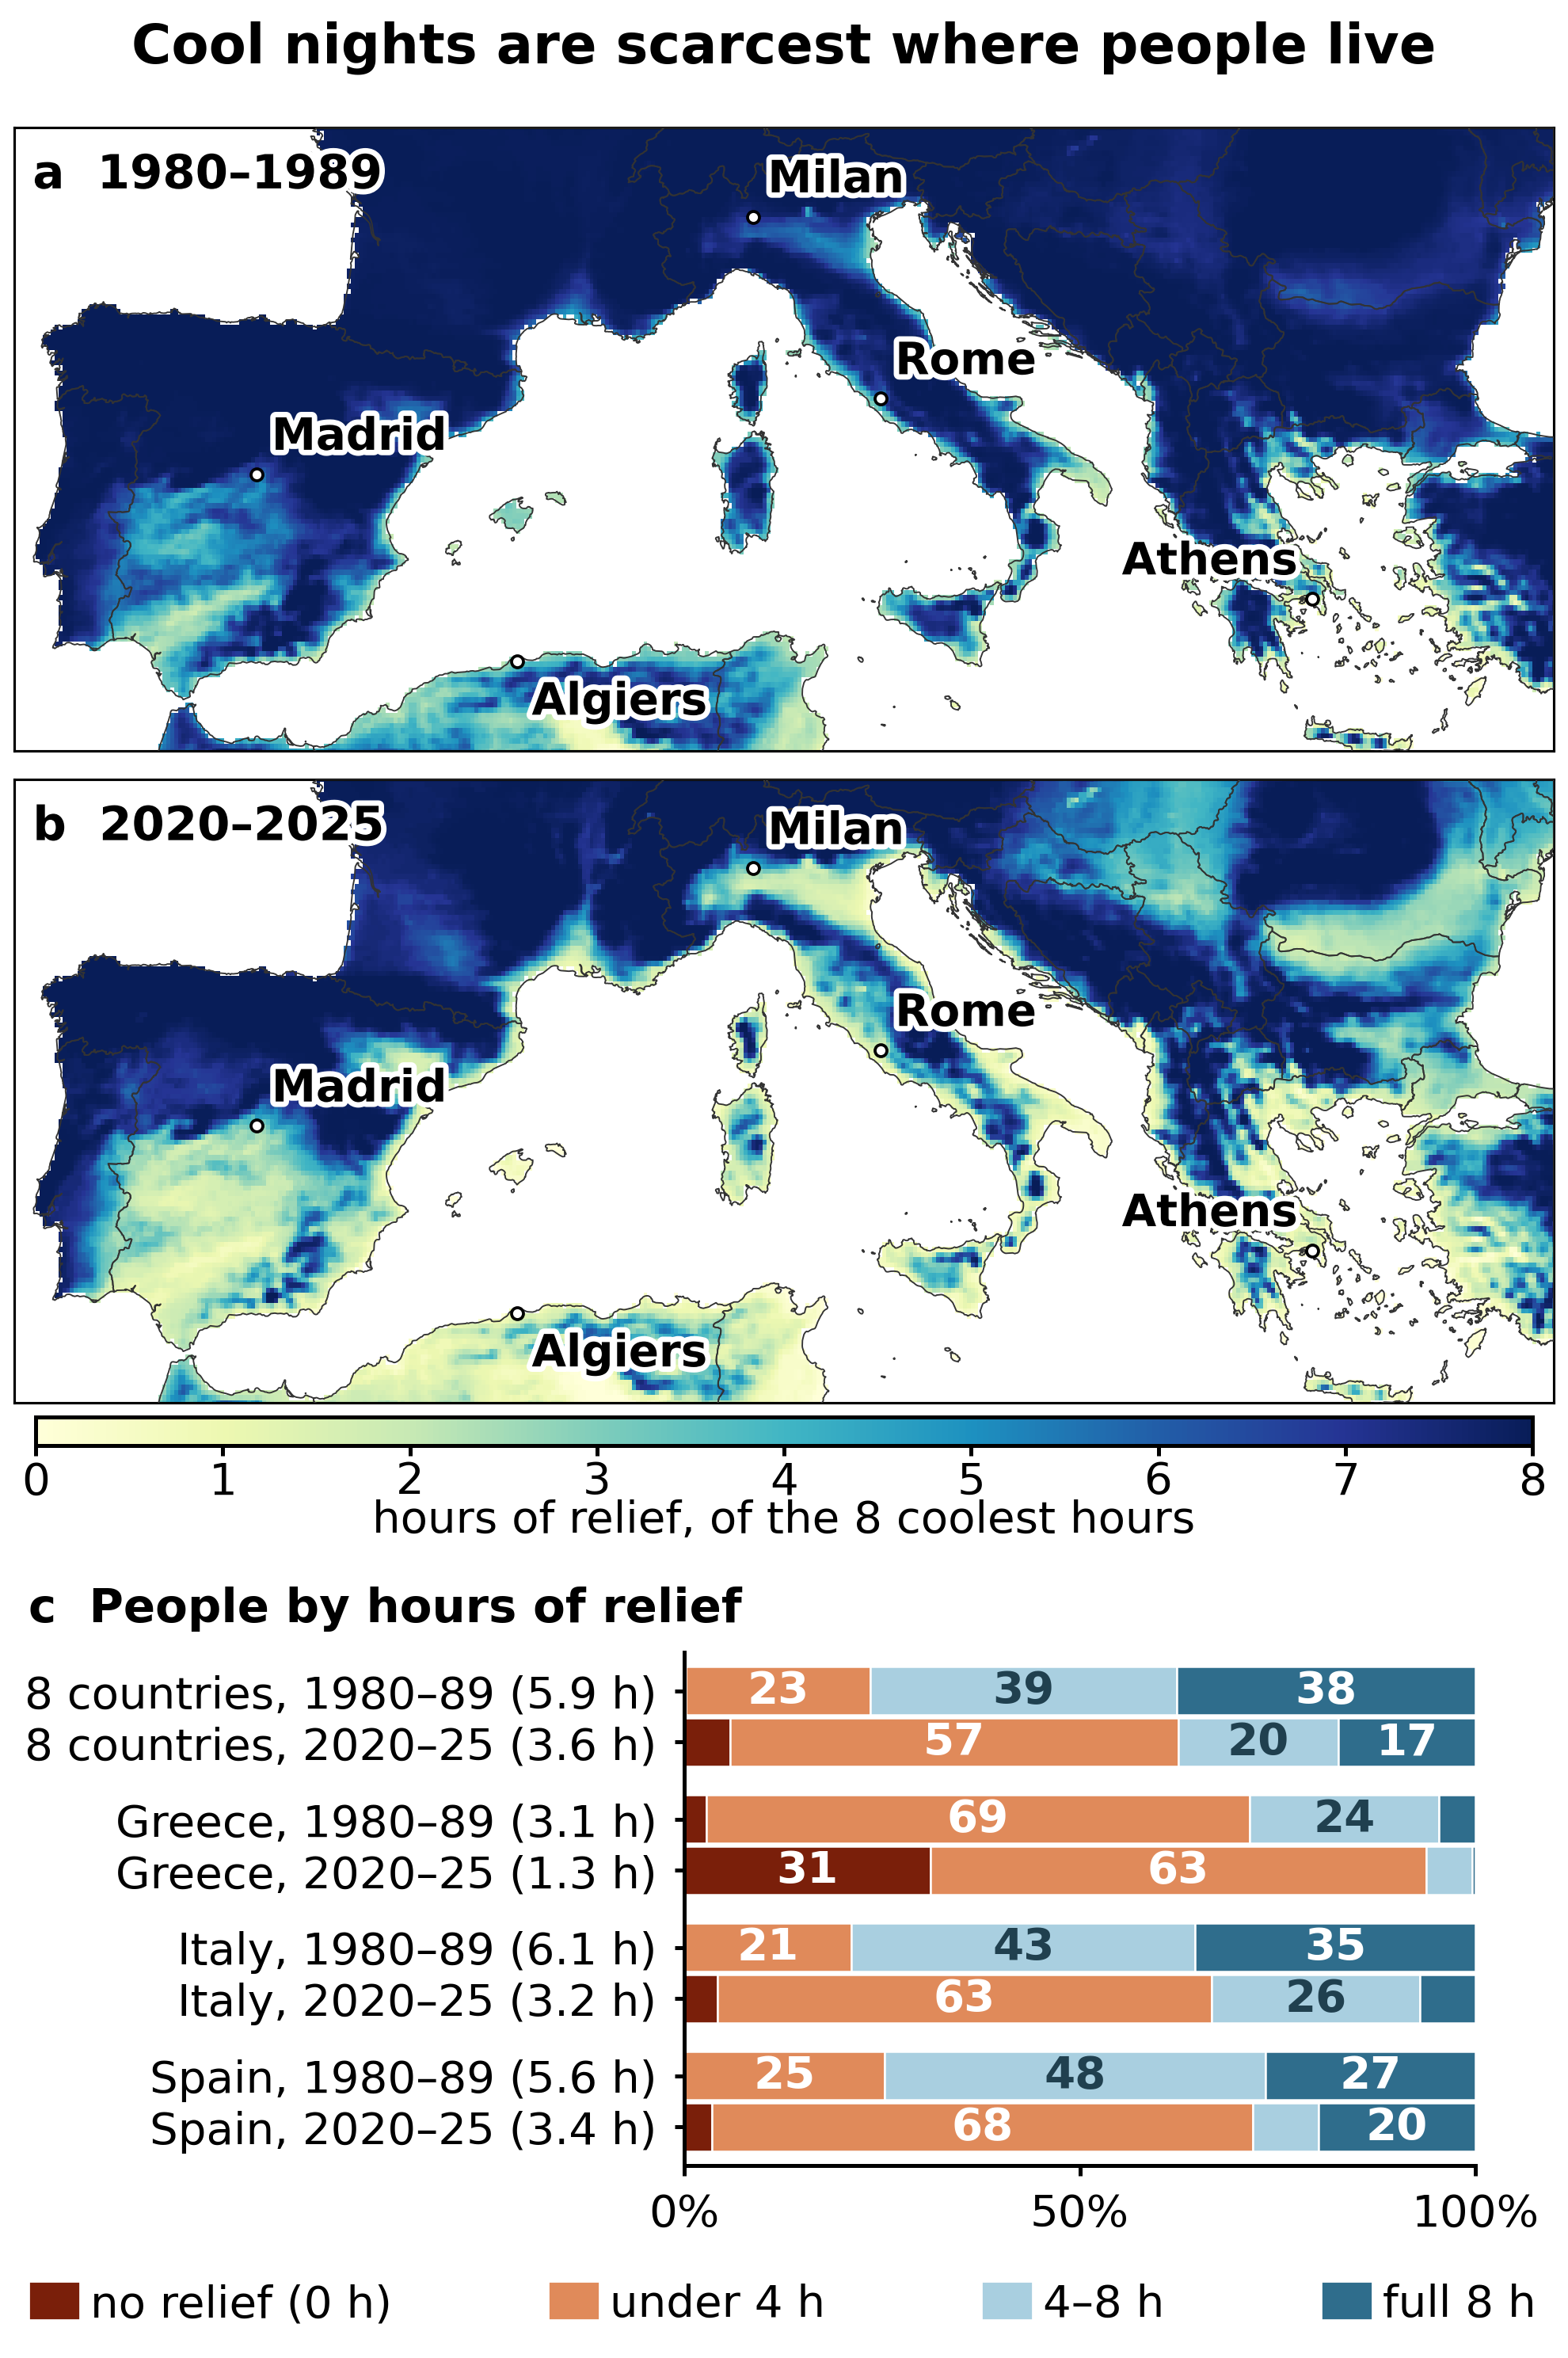
make_fig3.py.Check the article in three commands
pip install -r requirements.txt
cd code
python check_numbers.py     # recomputes 68 published numbers, PASS/FAIL each
python make_fig1.py en      # also make_fig2.py, make_fig3.py; "it" for Italian
python check_cities.py      # does each quoted place's value describe the place?
Nothing is downloaded and no account is needed: the intermediate data (3 MB) is in the repository. On the published data, all 68 numbers reproduce, and the figure scripts redraw the published figures from the shared data (titles and margins can shift by a few pixels between matplotlib versions). To rebuild the intermediate data from the public sources, see the README.
Data sources
| Dataset | Provider |
|---|---|
| ERA5-Land monthly averages by hour of day, 2 m temperature, 0.1° | Copernicus Climate Change Service |
| 5 km census population grid, 2021 | Eurostat GISCO (© European Union, Eurostat; CC BY 4.0, as stated on Eurostat's census-grid 2021 page) |
| Country outlines, 1:10m | Natural Earth |
What is checked, and what is not
All 68 checks run from the shared data, including the ±0.7 °C sampling uncertainty (±0.9 °C in Greece), which is recomputed by resampling the summers year by year, and the month-by-month claims, from ERA5-Land monthly means. Rebuilding the data from the raw downloads is possible and was verified: every file comes back identical. The README lists what is not checked.
How to cite
Cite the archive, not the post. One Zenodo record holds this issue's code and data together: Gallotti, R. (2026). BIG IF TRUE #001, Southern Europe has stopped cooling down at night: code and data (v1.0.0). Zenodo. DOI: 10.5281/zenodo.23158810.
Cards on the table
This analysis was written and run by Claude Opus 5 under the author's direction, not re-read line by line and not peer-reviewed. The bug log (17 entries) records the errors found and fixed, and KEY_NUMBERS.md lists every number in the article. Found a difference? Open an issue.
Related peer-reviewed work: Vavassori, Žgela & Brovelli, Applied Geomatics 18:84 (2026), open access. Health and cooling sources are listed in the README.
This measures availability of cool air, not sleep. ERA5-Land has no urban canopy, so city values are a floor.